| Electron temperature summary plots | Ion temperature summary plots | Ion velocity summary plots | Ion velocity (high) summary plots |
|---|
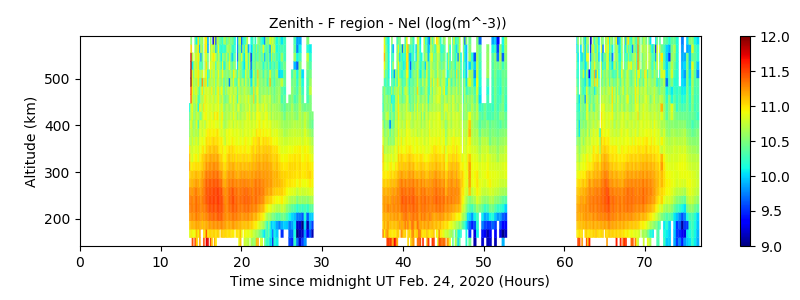
This is an experiment designed to measure the regional mid-latitude E and F region ionosphere in the vertical direction and geographic south. High accuracy plasma line data and medium length integration periods are used to monitor ionospheric features.
This page has the following summary plots of electron density:
|
|
|
|
|
|
|
|