Electron density summary plots for Millstone Hill Radar

Nov. 13, 2025

Electron temperature summary plots Ion temperature summary plots Ion velocity summary plots Ion velocity (high) summary plots

CME Regional Geospace Storm Experiment

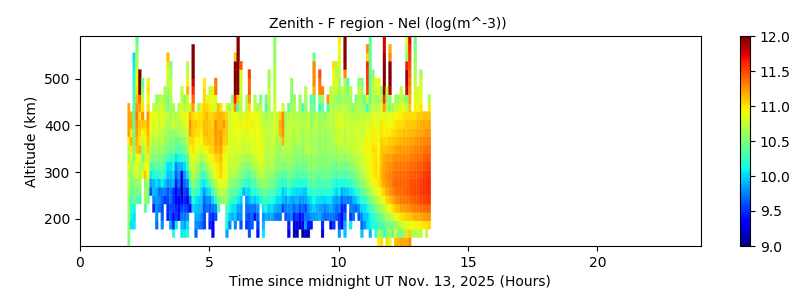
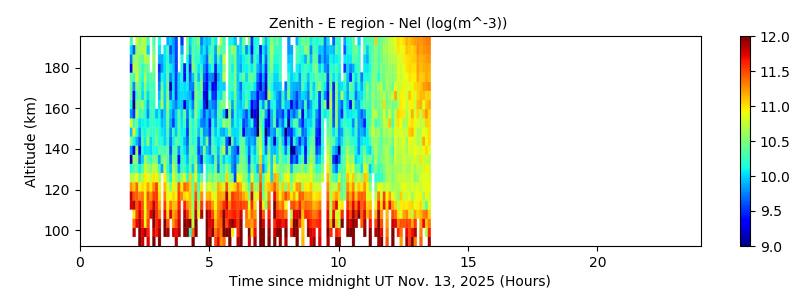
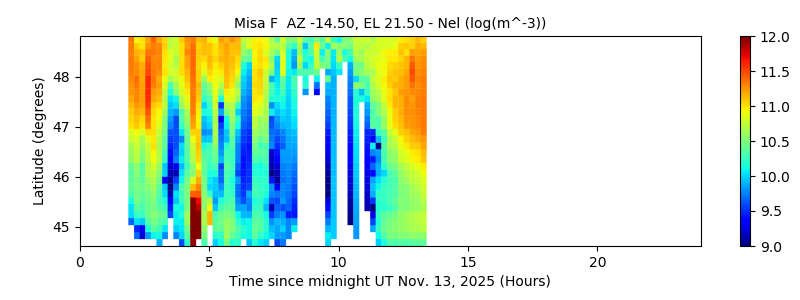
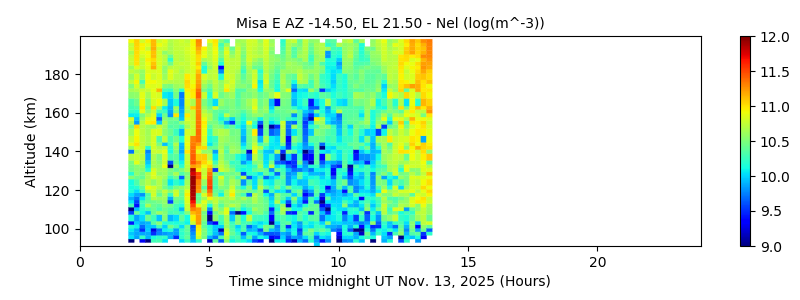
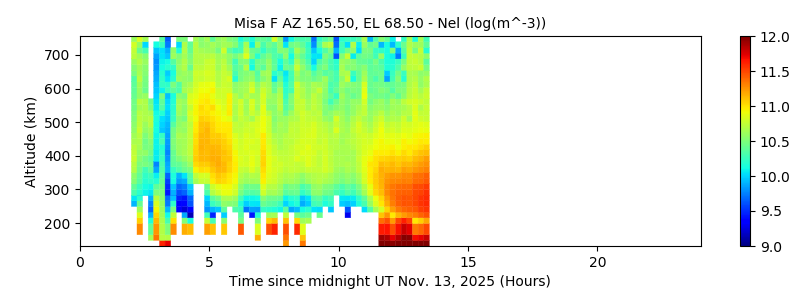
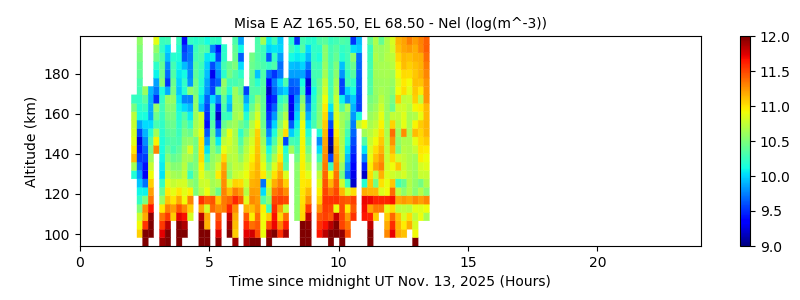
This is an experiment designed to measure the E, F ionosphere regions in both the upB and perpB directions, using the i_a480_s480 waveform, 3 minutes for each antenna position.

This page has the following summary plots of electron density:

  1. Zenith - F region - Nel
  2. Zenith - E region - Nel
  3. Misa F AZ -14.50, EL 21.50 - Nel
  4. Misa E AZ -14.50, EL 21.50 - Nel
  5. Misa F AZ 165.50, EL 68.50 - Nel
  6. Misa E AZ 165.50, EL 68.50 - Nel
Zenith - F region - Nel
Zenith - E region - Nel
Misa F  AZ -14.50, EL 21.50 - Nel
Misa E AZ -14.50, EL 21.50 - Nel
Misa F AZ 165.50, EL 68.50 - Nel
Misa E AZ 165.50, EL 68.50 - Nel