
| Electron density summary plots | Electron temperature summary plots | Ion velocity summary plots | Ion velocity (high) summary plots |
|---|
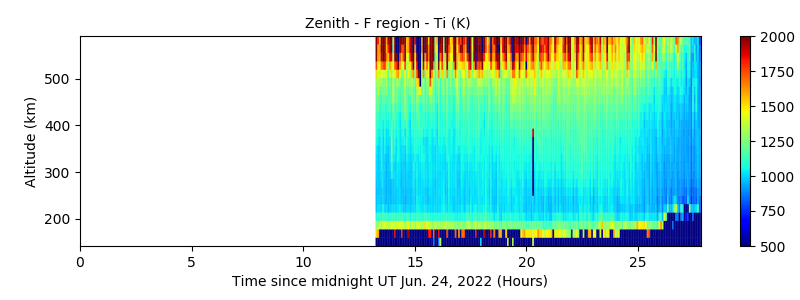
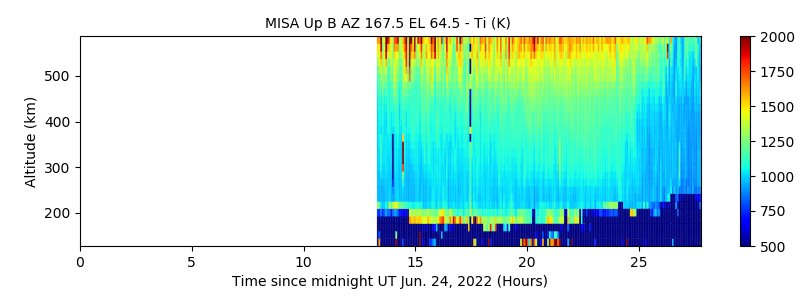
This is an experiment designed to measure the regional mid-latitude E and F region ionosphere in the vertical direction and in a direction along the magnetic field line at F region altitudes.
This page has the following summary plots of ion temperature:
|
|
|
|
|
|